Graphing
Do you need to convert your data into graphical plots? Allow our experienced figure experts do the work for you. We create illustrative graphs and charts in 2D or 3D effects from spread sheets or tabulated data.
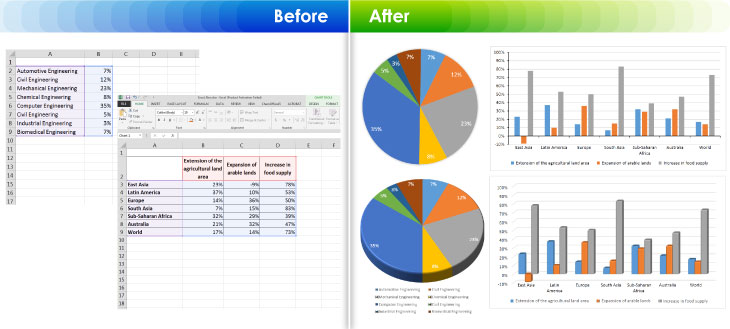
Simply send us your raw data and we will:
- Check the graphical requirements of your target journal
- Professionally and accurately present your data
- Create publication-ready graphics
Render statistical, mathematical, chemical, etc. images from hand drawings
Create 2D and 3D figures based on Author requirements
Render high complex tables of any size as per client requirements
Figure Formatting
Adjust the resolution, file type, size, colours, and font in your figures to ensure that they comply with your target journal’s guidelines.
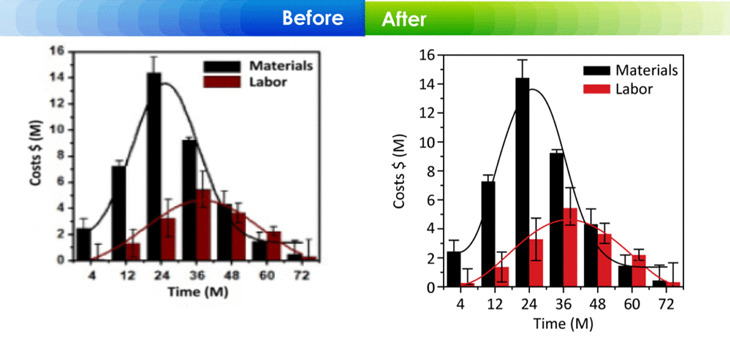
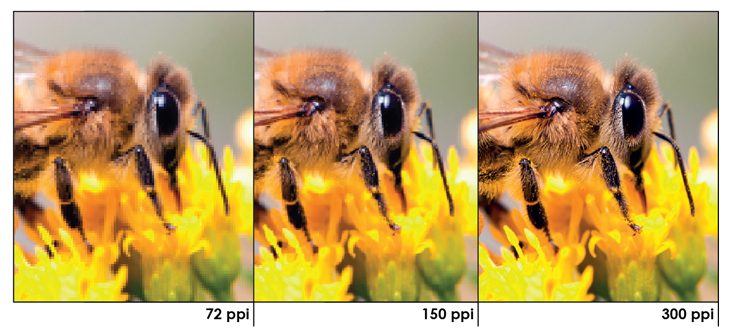
Resolution and colour adjustment for clarity
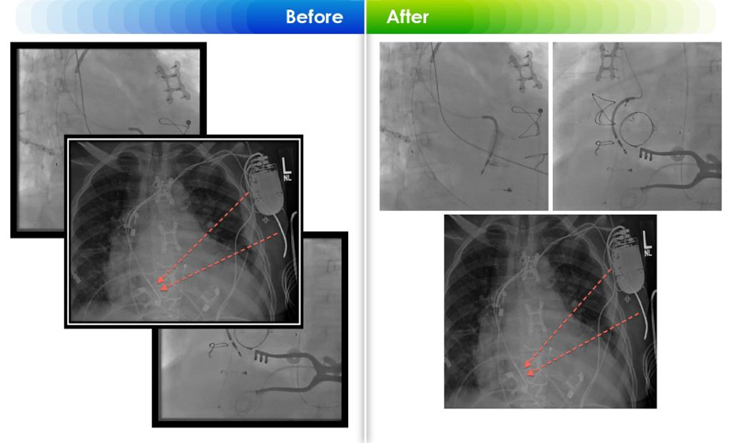
Manage Inpainting process to crop distracting parts and reconstruct lost elements
Merge multiple images to form single figure, multi-part images
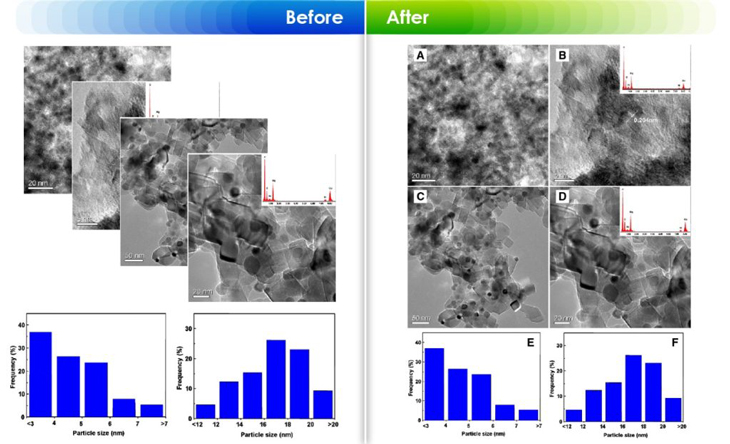
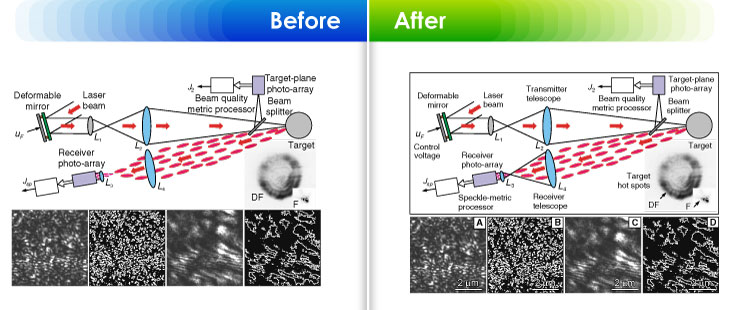
Redraw curves, lines, shapes, legends, Scale bar, and labels for consistency
Adjust the image resolution to ensure that your images comply with your target journal’s guidelines
Custom Illustration
Our experienced illustrators will adjust the resolution, file type, size, colours, and font in your figures to ensure that they comply with your target journal’s guidelines. We can refine or redraw images, e.g. line art, 3D diagrams, and colour artwork.
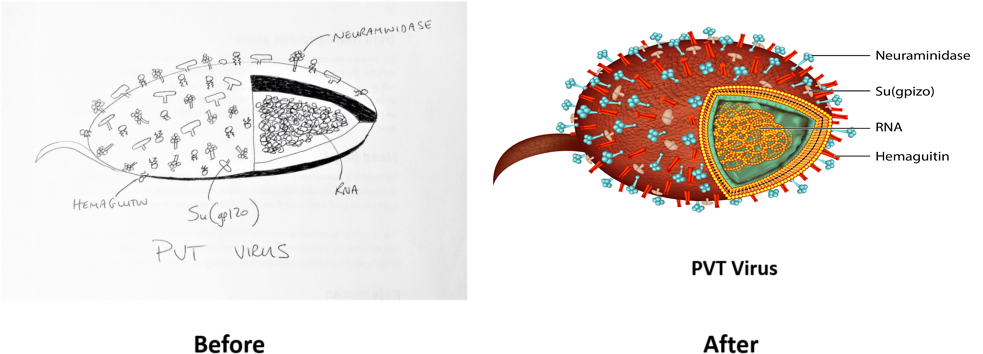
International Science Editing‘s scientific and medical illustrators create superior quality, professional images for your research paper, book or presentation.
Simply upload your existing figure/sketch (we accept most popular file formats) and provide us with the name of your target journal.
Request a free quotation, giving details of requirements, and receive quotation and delivery date within 1 working day.
×